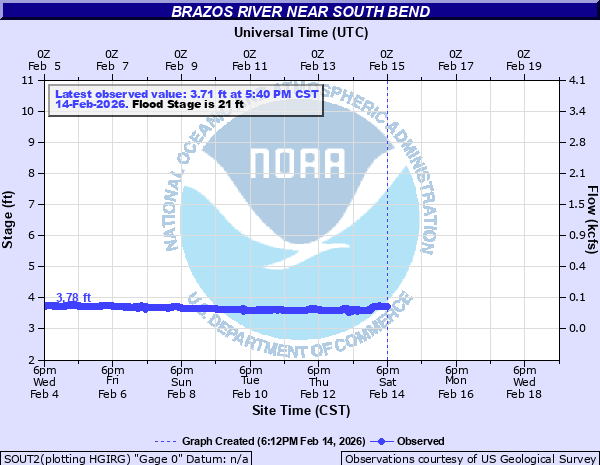
Brazos River near South Bend
Critical Stages
19' - Action
21' - Flood
28' - Moderate
34' - Major
Latest Observation
Updated: 1:55 AM CST 12/16/25
Status: No Flooding
Stage: 3.47 ft
Flow: 0.016 kcfs
Forecast
Forecast not available for this location.
| Time | Stage (ft) | Flow (kcfs) |
|---|---|---|
| 1:55 AM 12/16 | 3.47 | 0.016 |
| 1:50 AM 12/16 | 3.47 | 0.016 |
| 1:45 AM 12/16 | 3.47 | 0.016 |
| 1:40 AM 12/16 | 3.47 | 0.016 |
| 1:35 AM 12/16 | 3.47 | 0.016 |
| 1:30 AM 12/16 | 3.47 | 0.016 |
| 1:25 AM 12/16 | 3.47 | 0.016 |
| 1:20 AM 12/16 | 3.47 | 0.016 |
| 1:15 AM 12/16 | 3.47 | 0.016 |
| 1:10 AM 12/16 | 3.47 | 0.016 |
| 1:05 AM 12/16 | 3.47 | 0.016 |
| 1:00 AM 12/16 | 3.47 | 0.016 |
| 12:55 AM 12/16 | 3.47 | 0.016 |
| 12:50 AM 12/16 | 3.47 | 0.016 |
| 12:45 AM 12/16 | 3.47 | 0.016 |
| 12:40 AM 12/16 | 3.47 | 0.016 |
| 12:35 AM 12/16 | 3.47 | 0.016 |
| 12:30 AM 12/16 | 3.47 | 0.016 |
| 12:25 AM 12/16 | 3.47 | 0.016 |
| 12:20 AM 12/16 | 3.47 | 0.016 |
| 12:15 AM 12/16 | 3.47 | 0.016 |
| 12:10 AM 12/16 | 3.47 | 0.016 |
| 12:05 AM 12/16 | 3.47 | 0.016 |
| 12:00 AM 12/16 | 3.47 | 0.016 |
| 11:55 PM 12/15 | 3.47 | 0.016 |
| 11:50 PM 12/15 | 3.47 | 0.016 |
| 11:45 PM 12/15 | 3.47 | 0.016 |
| 11:40 PM 12/15 | 3.47 | 0.016 |
| 11:35 PM 12/15 | 3.47 | 0.016 |
| 11:30 PM 12/15 | 3.47 | 0.016 |
41' -
Major flooding is expected along the river near Graham. Highway 67 will be impassable near the river.
39' -
Major flooding is expected along the river near Graham. The Highway 67 bridge approach ramps will be inundated.
34' -
Major flooding is expected along the river. The rural RV park near the gage will experience widespread flooding.
28' -
Moderate flooding is expected along the river. The rural RV park near the gage will be inundated with several feet of water.
26' -
Minor flooding is expected along the river. The FM 1287 bridge approaches downstream of the gage may begin to flood. Pasturelands near the river will flood.
21' -
Minor flooding is expected along the river. Pasturelands near the river will flood.
| Date | Stage (ft) |
|---|---|
| Aug 6, 1978 | 41.5 |
| Jan 1, 1976 | 36.2 |
| Jun 16, 1930 | 35.5 |
| May 4, 1990 | 34.27 |
| Apr 29, 1957 | 32.7 |
| Oct 15, 1981 | 30.35 |
| Sep 24, 1900 | 29.5 |
| Jun 27, 1982 | 28.92 |
| Sep 26, 1955 | 28.73 |
| Dec 22, 1991 | 28.2 |
| Jan 1, 1908 | 27.5 |
| Jun 30, 2007 | 27.5 |
| May 4, 1941 | 27.35 |
| Sep 30, 1955 | 27.1 |
| Jun 4, 2021 | 26.76 |
| Jun 7, 2016 | 26.34 |
| Feb 27, 1992 | 26.16 |
| Oct 2, 1980 | 25.79 |
| Sep 9, 1962 | 24.9 |
| Oct 17, 2018 | 24.72 |
Data provided by the National Weather Service.