Mississippi River at Winona - Pool 6
Critical Stages
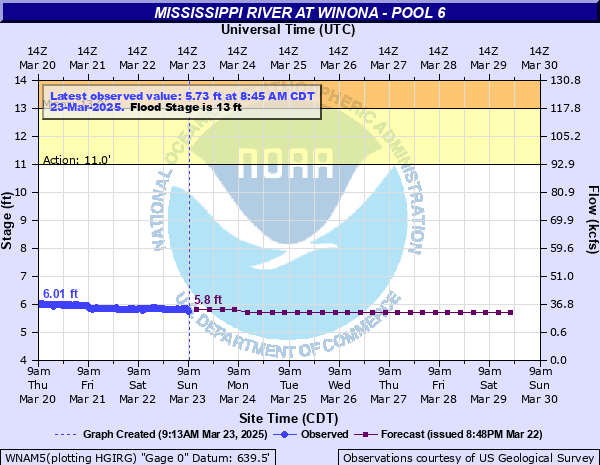
11' - Action
13' - Flood
15' - Moderate
18' - Major
Latest Observation
Updated: 10:45 AM CST 12/15/25
Status: No Flooding
Stage: 5.61 ft
Flow: 18.9 kcfs
Forecast
Forecast not available for this location.
| Time | Stage (ft) | Flow (kcfs) |
|---|---|---|
| 10:45 AM 12/15 | 5.61 | 18.9 |
| 10:30 AM 12/15 | 5.61 | 18.9 |
| 10:15 AM 12/15 | 5.61 | 18.9 |
| 10:00 AM 12/15 | 5.6 | 18.1 |
| 9:45 AM 12/15 | 5.6 | 18.1 |
| 9:30 AM 12/15 | 5.6 | 18.1 |
| 9:15 AM 12/15 | 5.6 | 18.1 |
| 9:00 AM 12/15 | 5.6 | 18.1 |
| 8:45 AM 12/15 | 5.6 | 18.1 |
| 8:30 AM 12/15 | 5.6 | 18.1 |
| 8:15 AM 12/15 | 5.61 | 18.9 |
| 8:00 AM 12/15 | 5.6 | 18.1 |
| 7:45 AM 12/15 | 5.6 | 18.1 |
| 7:30 AM 12/15 | 5.6 | 18.1 |
| 7:15 AM 12/15 | 5.6 | 18.1 |
| 7:00 AM 12/15 | 5.61 | 18.9 |
| 6:45 AM 12/15 | 5.61 | 18.9 |
| 6:30 AM 12/15 | 5.61 | 18.9 |
| 6:15 AM 12/15 | 5.61 | 18.9 |
| 6:00 AM 12/15 | 5.61 | 18.9 |
| 5:45 AM 12/15 | 5.61 | 18.9 |
| 5:30 AM 12/15 | 5.61 | 18.9 |
| 5:15 AM 12/15 | 5.61 | 18.9 |
| 5:00 AM 12/15 | 5.61 | 18.9 |
| 4:45 AM 12/15 | 5.61 | 18.9 |
| 4:30 AM 12/15 | 5.61 | 18.9 |
| 4:15 AM 12/15 | 5.61 | 18.9 |
| 4:00 AM 12/15 | 5.61 | 18.9 |
| 3:45 AM 12/15 | 5.61 | 18.9 |
| 3:30 AM 12/15 | 5.61 | 18.9 |
25' -
Water levels reach the top of the emergency dike.
24' -
Water overtops the levee downtown.
22' -
Water levels reach the designed dike protection level.
20.77' -
The water reaches the flood of record set in 1965.
20.5' -
Railroad lines go under water.
17' -
Some railroad lines may become inoperative.
16.6' -
Lock and Dam 6 goes out of operation.
16' -
Lock and Dam 5A goes out of operation.
13' -
Prairie Island Park begins to flood. Pumping operations are underway by the city of Winona, and dike patrols are started.
12.5' -
Spillway lot and Saint Charles Street boat launch is barricaded.
10.5' -
Pumping stations are put into operation along Washington, Kansas, and High Forest streets.
10' -
Olmstead Street Pumping Station is put into operation.
9' -
East Riverfront Street along Levee Park is closed due to flooding.
| Date | Stage (ft) |
|---|---|
| Apr 19, 1965 | 20.77 |
| Apr 17, 2001 | 20.07 |
| Apr 19, 1969 | 19.44 |
| Apr 26, 2023 | 18.81 |
| Apr 11, 1997 | 18.3 |
| Apr 20, 1952 | 17.93 |
| Apr 18, 1951 | 17.36 |
| Apr 3, 2019 | 17.3 |
| Apr 7, 1967 | 16.92 |
| Jun 18, 1880 | 16.87 |
| May 2, 1975 | 16.6 |
| Apr 15, 2011 | 16.58 |
| Apr 7, 1986 | 16.53 |
| Jun 26, 1993 | 16.53 |
| Apr 9, 1897 | 16.5 |
| May 7, 1954 | 16.3 |
| Apr 27, 1916 | 16.2 |
| Jul 2, 2024 | 16.14 |
| Apr 1, 1920 | 16 |
| Jul 2, 2014 | 15.52 |
Data provided by the National Weather Service.