East Fork Trinity River near Crandall
Critical Stages
16' - Action
18' - Flood
20' - Moderate
22' - Major
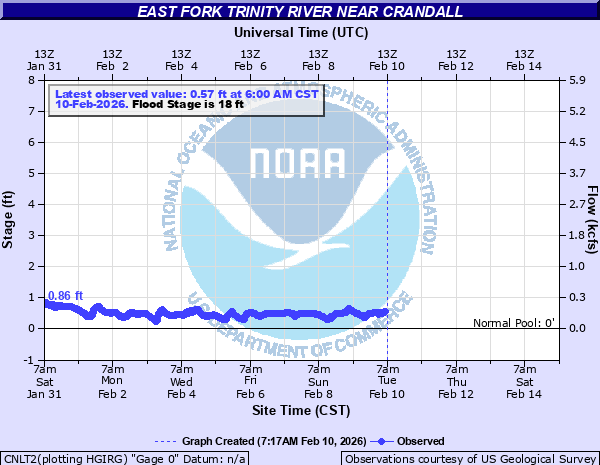
Latest Observation
Updated: 11:00 AM CST 12/7/25
Status: No Flooding
Stage: 0.56 ft
Flow: 0.096 kcfs
Forecast
Forecast not available for this location.
| Time | Stage (ft) | Flow (kcfs) |
|---|---|---|
| 11:00 AM 12/7 | 0.56 | 0.096 |
| 10:45 AM 12/7 | 0.55 | 0.0929 |
| 10:30 AM 12/7 | 0.55 | 0.0929 |
| 10:15 AM 12/7 | 0.59 | 0.106 |
| 10:00 AM 12/7 | 0.59 | 0.106 |
| 9:45 AM 12/7 | 0.58 | 0.102 |
| 9:30 AM 12/7 | 0.6 | 0.109 |
| 9:15 AM 12/7 | 0.61 | 0.112 |
| 9:00 AM 12/7 | 0.62 | 0.115 |
| 8:45 AM 12/7 | 0.63 | 0.119 |
| 8:30 AM 12/7 | 0.63 | 0.119 |
| 8:15 AM 12/7 | 0.63 | 0.119 |
| 8:00 AM 12/7 | 0.63 | 0.119 |
| 7:45 AM 12/7 | 0.64 | 0.122 |
| 7:30 AM 12/7 | 0.64 | 0.122 |
| 7:15 AM 12/7 | 0.64 | 0.122 |
| 7:00 AM 12/7 | 0.65 | 0.126 |
| 6:45 AM 12/7 | 0.65 | 0.126 |
| 6:30 AM 12/7 | 0.65 | 0.126 |
| 6:15 AM 12/7 | 0.66 | 0.129 |
| 6:00 AM 12/7 | 0.66 | 0.129 |
| 5:45 AM 12/7 | 0.66 | 0.129 |
| 5:30 AM 12/7 | 0.67 | 0.132 |
| 5:15 AM 12/7 | 0.67 | 0.132 |
| 5:00 AM 12/7 | 0.67 | 0.132 |
| 4:45 AM 12/7 | 0.67 | 0.132 |
| 4:30 AM 12/7 | 0.67 | 0.132 |
| 4:15 AM 12/7 | 0.67 | 0.132 |
| 4:00 AM 12/7 | 0.68 | 0.136 |
| 3:45 AM 12/7 | 0.68 | 0.136 |
27.2' -
Major flooding is expected. Several levees will fail and serious flooding will occur along the river.
25' -
Major flooding is expected. Several levees will be overtopped, and a few will fail.
23' -
Major flooding is expected. A few levees may be overtopped.
22' -
Major out of bank flooding is expected. Caution should be exercised near the river. Farm and ranch land near the river will be underwater. Rural roads will be flooded, and some road blockages will be necessary.
20' -
Moderate out of banks flooding is expected. Caution should be exercised near the river. Several rural roads will be underwater. Farm and ranch land near the river will be flooded.
18' -
Minor out of banks flooding is expected. Caution should be exercised near the river.
| Date | Stage (ft) |
|---|---|
| May 5, 1990 | 27.17 |
| Jun 1, 2015 | 23.94 |
| Mar 18, 1989 | 23.58 |
| Nov 29, 2015 | 22.83 |
| May 28, 1957 | 22.81 |
| Mar 19, 2008 | 22.27 |
| May 4, 1950 | 22.12 |
| Apr 14, 1991 | 21.97 |
| Dec 22, 1991 | 21.95 |
| May 1, 1966 | 21.25 |
| Dec 10, 1971 | 21.25 |
| Feb 21, 1983 | 20.15 |
| May 8, 1969 | 20.1 |
| May 2, 1953 | 19.87 |
| Feb 17, 2001 | 19.69 |
| Jun 5, 1973 | 19.5 |
| Mar 28, 1977 | 19.26 |
| Aug 23, 2022 | 19.03 |
| May 9, 1995 | 18.84 |
| Dec 29, 2015 | 18.69 |
Data provided by the National Weather Service.