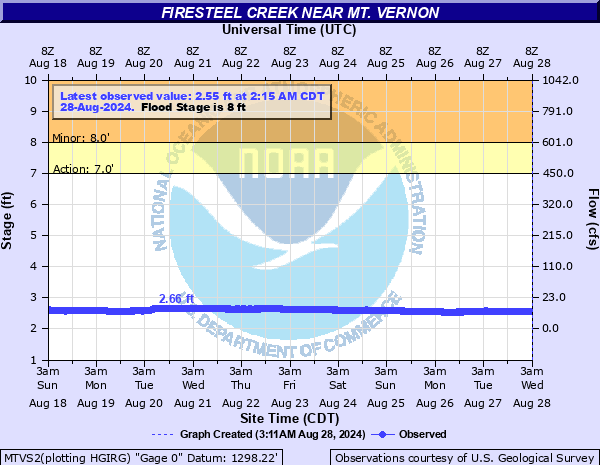
Firesteel Creek near Mt. Vernon
Critical Stages
7' - Action
8' - Flood
13' - Moderate
15' - Major
Latest Observation
Updated: 9:15 PM CST 12/15/25
Status: No Flooding
Stage: 2.21 ft
Flow: 0.001 kcfs
Forecast
Forecast not available for this location.
| Time | Stage (ft) | Flow (kcfs) |
|---|---|---|
| 9:15 PM 12/15 | 2.21 | 0.001 |
| 9:00 PM 12/15 | 2.21 | 0.001 |
| 8:45 PM 12/15 | 2.21 | 0.001 |
| 8:30 PM 12/15 | 2.21 | 0.001 |
| 8:15 PM 12/15 | 2.22 | 0.001 |
| 8:00 PM 12/15 | 2.22 | 0.001 |
| 7:45 PM 12/15 | 2.21 | 0.001 |
| 7:30 PM 12/15 | 2.21 | 0.001 |
| 7:15 PM 12/15 | 2.21 | 0.001 |
| 7:00 PM 12/15 | 2.21 | 0.001 |
| 6:45 PM 12/15 | 2.21 | 0.001 |
| 6:30 PM 12/15 | 2.21 | 0.001 |
| 6:15 PM 12/15 | 2.21 | 0.001 |
| 6:00 PM 12/15 | 2.21 | 0.001 |
| 5:45 PM 12/15 | 2.21 | 0.001 |
| 5:30 PM 12/15 | 2.21 | 0.001 |
| 5:15 PM 12/15 | 2.21 | 0.001 |
| 5:00 PM 12/15 | 2.21 | 0.001 |
| 4:45 PM 12/15 | 2.21 | 0.001 |
| 4:30 PM 12/15 | 2.21 | 0.001 |
| 4:15 PM 12/15 | 2.21 | 0.001 |
| 4:00 PM 12/15 | 2.21 | 0.001 |
| 3:45 PM 12/15 | 2.21 | 0.001 |
| 3:30 PM 12/15 | 2.21 | 0.001 |
| 3:15 PM 12/15 | 2.21 | 0.001 |
| 3:00 PM 12/15 | 2.21 | 0.001 |
| 2:45 PM 12/15 | 2.21 | 0.001 |
| 2:30 PM 12/15 | 2.21 | 0.001 |
| 2:15 PM 12/15 | 2.21 | 0.001 |
| 2:00 PM 12/15 | 2.21 | 0.001 |
19' -
The bridge on 398th Avenue at the gage is overtopped.
18' -
403rd Ave north of the bridge will begin to flood.
17' -
The water reaches the bottom of the bridge on 398th Avenue at the gage and the low spot in the road south of the bridge will be flooded.
14.5' -
The bridge on 405th Ave will be overtopped.
13.5' -
The bridge on 404th Avenue is overtopped.
13' -
The left bank overflows.
12' -
The water reaches the bottom of the bridge on 404th Avenue.
8' -
The right bank overflows.
7.5' -
Water reaches the bottom of the bridge 2 1/2 miles west of Storla.
| Date | Stage (ft) |
|---|---|
| Apr 3, 1969 | 17.12 |
| Jun 22, 2024 | 16.94 |
| Jul 31, 2010 | 16.04 |
| Jun 21, 1984 | 15.56 |
| Apr 4, 1969 | 15.34 |
| Sep 13, 2019 | 15.16 |
| Mar 28, 1960 | 15.13 |
| May 10, 1995 | 14.99 |
| Mar 22, 2019 | 14.55 |
| May 10, 1986 | 14.48 |
| Jun 23, 2011 | 14.18 |
| Mar 17, 2011 | 13.86 |
| Mar 16, 1985 | 13.41 |
| May 7, 2007 | 12.73 |
| Apr 24, 2001 | 12.35 |
| Mar 28, 1987 | 11.96 |
| May 7, 1999 | 11.87 |
| Mar 21, 1978 | 11.61 |
| Jul 5, 1993 | 11.48 |
| Mar 4, 2020 | 11.46 |
Data provided by the National Weather Service.