« Back to Yellowstone Lake Rivers
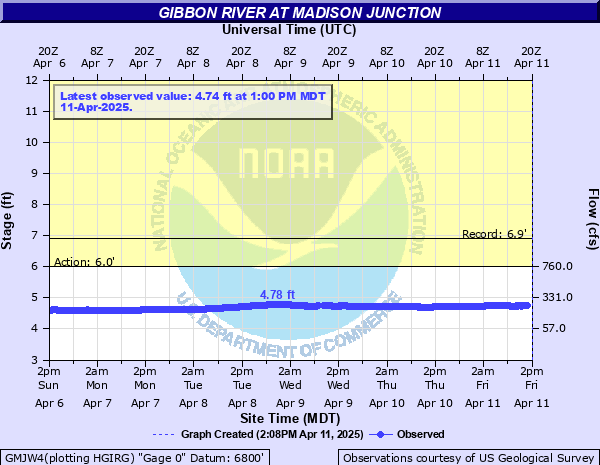
Gibbon River at Madison Junction
Critical Stages
6' - Action
Flood
Moderate
Major
Latest Observation
Updated: 12:00 AM MST 12/15/25
Status: No Flooding
Stage: 4.65 ft
Flow: 0.219 kcfs
Forecast
Forecast not available for this location.
| Time | Stage (ft) | Flow (kcfs) |
|---|---|---|
| 12:00 AM 12/15 | 4.65 | 0.219 |
| 11:45 PM 12/14 | 4.65 | 0.219 |
| 11:30 PM 12/14 | 4.65 | 0.219 |
| 11:15 PM 12/14 | 4.65 | 0.219 |
| 11:00 PM 12/14 | 4.65 | 0.219 |
| 10:45 PM 12/14 | 4.65 | 0.219 |
| 10:30 PM 12/14 | 4.65 | 0.219 |
| 10:15 PM 12/14 | 4.65 | 0.219 |
| 10:00 PM 12/14 | 4.65 | 0.219 |
| 9:45 PM 12/14 | 4.65 | 0.219 |
| 9:30 PM 12/14 | 4.65 | 0.219 |
| 9:15 PM 12/14 | 4.65 | 0.219 |
| 9:00 PM 12/14 | 4.65 | 0.219 |
| 8:45 PM 12/14 | 4.65 | 0.219 |
| 8:30 PM 12/14 | 4.65 | 0.219 |
| 8:15 PM 12/14 | 4.65 | 0.219 |
| 8:00 PM 12/14 | 4.65 | 0.219 |
| 7:45 PM 12/14 | 4.66 | 0.221 |
| 7:30 PM 12/14 | 4.65 | 0.219 |
| 7:15 PM 12/14 | 4.66 | 0.221 |
| 7:00 PM 12/14 | 4.66 | 0.221 |
| 6:45 PM 12/14 | 4.66 | 0.221 |
| 6:30 PM 12/14 | 4.66 | 0.221 |
| 6:15 PM 12/14 | 4.66 | 0.221 |
| 6:00 PM 12/14 | 4.66 | 0.221 |
| 5:45 PM 12/14 | 4.66 | 0.221 |
| 5:30 PM 12/14 | 4.66 | 0.221 |
| 5:15 PM 12/14 | 4.66 | 0.221 |
| 5:00 PM 12/14 | 4.66 | 0.221 |
| 4:45 PM 12/14 | 4.66 | 0.221 |
6.43' -
Record stage and flow--1,110 cfs (6/8/2011).
5.5' -
Bankfull stage.
| Date | Stage (ft) |
|---|---|
| Jun 13, 2022 | 6.91 |
| Jun 8, 2011 | 6.43 |
| May 20, 2008 | 6.31 |
| May 24, 2018 | 6.29 |
| May 13, 2017 | 5.98 |
| May 20, 2009 | 5.97 |
| May 16, 2001 | 5.93 |
| May 23, 0023 | 5.76 |
| May 26, 2014 | 5.73 |
| May 17, 2019 | 5.63 |
| May 23, 2020 | 5.57 |
| Jun 5, 2010 | 5.4 |
| May 26, 2021 | 5.39 |
| Jul 27, 2012 | 5.34 |
| May 20, 2006 | 5.26 |
| May 17, 2015 | 5.19 |
| May 20, 2005 | 5.08 |
| May 1, 2007 | 5.04 |
| May 14, 2013 | 4.99 |
| May 20, 2016 | 4.94 |
Data provided by the National Weather Service.