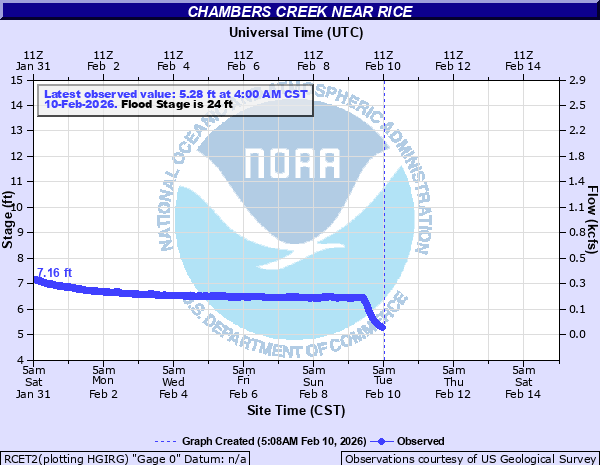
Chambers Creek near Rice
Critical Stages
22' - Action
24' - Flood
27' - Moderate
30' - Major
Latest Observation
Updated: 7:00 PM CST 12/8/25
Status: No Flooding
Stage: 5.01 ft
Flow: 0.0062 kcfs
Forecast
Forecast not available for this location.
| Time | Stage (ft) | Flow (kcfs) |
|---|---|---|
| 7:00 PM 12/8 | 5.01 | 0.0062 |
| 6:45 PM 12/8 | 5 | 0.006 |
| 6:30 PM 12/8 | 4.99 | 0.0058 |
| 6:15 PM 12/8 | 4.99 | 0.0058 |
| 6:00 PM 12/8 | 4.99 | 0.0058 |
| 5:45 PM 12/8 | 5 | 0.006 |
| 5:30 PM 12/8 | 4.99 | 0.0058 |
| 5:15 PM 12/8 | 4.99 | 0.0058 |
| 5:00 PM 12/8 | 5.01 | 0.0062 |
| 4:45 PM 12/8 | 5 | 0.006 |
| 4:30 PM 12/8 | 5.01 | 0.0062 |
| 4:15 PM 12/8 | 5 | 0.006 |
| 4:00 PM 12/8 | 5 | 0.006 |
| 3:45 PM 12/8 | 5.01 | 0.0062 |
| 3:30 PM 12/8 | 5.02 | 0.0065 |
| 3:15 PM 12/8 | 5.01 | 0.0062 |
| 3:00 PM 12/8 | 5.02 | 0.0065 |
| 2:45 PM 12/8 | 4.99 | 0.0058 |
| 2:30 PM 12/8 | 5.01 | 0.0062 |
| 2:15 PM 12/8 | 5 | 0.006 |
| 2:00 PM 12/8 | 5.01 | 0.0062 |
| 1:45 PM 12/8 | 5.01 | 0.0062 |
| 1:30 PM 12/8 | 5.01 | 0.0062 |
| 1:15 PM 12/8 | 5 | 0.006 |
| 1:00 PM 12/8 | 5 | 0.006 |
| 12:45 PM 12/8 | 5 | 0.006 |
| 12:30 PM 12/8 | 4.99 | 0.0058 |
| 12:15 PM 12/8 | 5 | 0.006 |
| 12:00 PM 12/8 | 5 | 0.006 |
| 11:45 AM 12/8 | 5 | 0.006 |
33.5' -
Flood waters will top the left bank levee. Major flooding will occur along the creek to the farm and ranch industries. Flood waters will top the left bank levee, and flooding will begin outside the levees. Danger also exists for the levees to fail along the left bank.
31' -
Major out of bank flooding is expected. Ranch and farm industries will be flooded. Rural roads will be underwater.
30' -
Major out of bank flooding along the creek is expected. Farm and ranch industries will be flooded. Several rural roads along the river will be flooded.
27' -
Moderate out of bank flooding will occur along the creek. A few rural roads will be flooded. Minor lowland flooding is expected for farms and ranches downstream.
24' -
Minor out of bank flooding will occur along the creek. This will be a problem for some cattle and farm industries.
| Date | Stage (ft) |
|---|---|
| Dec 21, 1991 | 32.57 |
| Oct 25, 2015 | 31.64 |
| Dec 21, 1997 | 31.51 |
| Oct 20, 1993 | 31.24 |
| Jun 6, 1986 | 31.12 |
| May 18, 1989 | 30.73 |
| May 26, 2015 | 30.68 |
| Jun 14, 2016 | 30.52 |
| May 12, 2015 | 30.4 |
| Oct 14, 2009 | 30.37 |
| Apr 1, 2007 | 30.27 |
| May 9, 1995 | 30.23 |
| Nov 13, 1998 | 30.21 |
| Mar 21, 2012 | 30.16 |
| May 4, 1990 | 30.04 |
| Feb 14, 1997 | 29.66 |
| Nov 29, 2015 | 29.42 |
| Mar 20, 2008 | 29.4 |
| Apr 25, 2008 | 29.29 |
| Nov 25, 2004 | 29.28 |
Data provided by the National Weather Service.