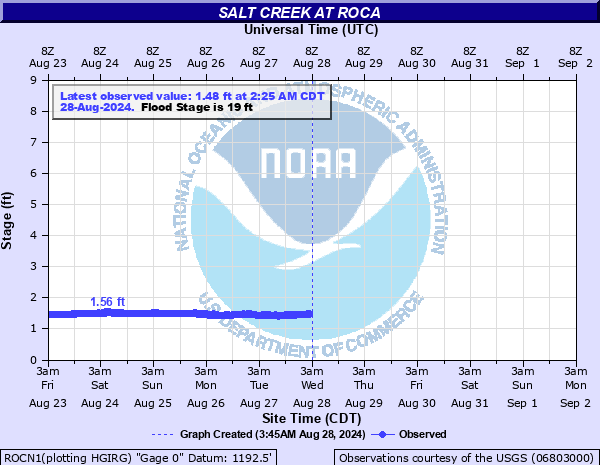
Salt Creek at Roca
Critical Stages
14' - Action
19' - Flood
21.5' - Moderate
23' - Major
Latest Observation
Updated: 1:25 AM CST 12/16/25
Status: No Flooding
Stage: 1.51 ft
Flow: 0.0052 kcfs
Forecast
Forecast not available for this location.
| Time | Stage (ft) | Flow (kcfs) |
|---|---|---|
| 1:25 AM 12/16 | 1.51 | 0.0052 |
| 1:20 AM 12/16 | 1.51 | 0.0052 |
| 1:15 AM 12/16 | 1.51 | 0.0052 |
| 1:10 AM 12/16 | 1.51 | 0.0052 |
| 1:05 AM 12/16 | 1.51 | 0.0052 |
| 1:00 AM 12/16 | 1.51 | 0.0052 |
| 12:55 AM 12/16 | 1.51 | 0.0052 |
| 12:50 AM 12/16 | 1.51 | 0.0052 |
| 12:45 AM 12/16 | 1.51 | 0.0052 |
| 12:40 AM 12/16 | 1.51 | 0.0052 |
| 12:35 AM 12/16 | 1.51 | 0.0052 |
| 12:30 AM 12/16 | 1.51 | 0.0052 |
| 12:25 AM 12/16 | 1.51 | 0.0052 |
| 12:20 AM 12/16 | 1.51 | 0.0052 |
| 12:15 AM 12/16 | 1.51 | 0.0052 |
| 12:10 AM 12/16 | 1.51 | 0.0052 |
| 12:05 AM 12/16 | 1.51 | 0.0052 |
| 12:00 AM 12/16 | 1.51 | 0.0052 |
| 11:55 PM 12/15 | 1.51 | 0.0052 |
| 11:50 PM 12/15 | 1.51 | 0.0052 |
| 11:45 PM 12/15 | 1.51 | 0.0052 |
| 11:40 PM 12/15 | 1.51 | 0.0052 |
| 11:35 PM 12/15 | 1.51 | 0.0052 |
| 11:30 PM 12/15 | 1.51 | 0.0052 |
| 11:25 PM 12/15 | 1.51 | 0.0052 |
| 11:20 PM 12/15 | 1.51 | 0.0052 |
| 11:15 PM 12/15 | 1.51 | 0.0052 |
| 11:10 PM 12/15 | 1.51 | 0.0052 |
| 11:05 PM 12/15 | 1.51 | 0.0052 |
| 11:00 PM 12/15 | 1.51 | 0.0052 |
26' -
Major flooding has inundated the vast majority of the reach as well as the town of Roca.
23.2' -
Roca begins to flood as the railroad tracks have been overtopped. Water is also likely flowing over the Roca Road bridge coming into town.
21.5' -
Widespread flooding is occurring along the reach.
20.5' -
Water reaches the bottom of the Roca Road bridge at the gage site.
19.5' -
Roca road west of the gage site floods.
19' -
Lowlands on the left bank begin to flood.
18' -
Saltillo Road located 2.8 miles downstream of the gage near Highway 77 floods.
| Date | Stage (ft) |
|---|---|
| May 8, 1950 | 26 |
| Jul 10, 1958 | 22.7 |
| Jun 2, 1951 | 22 |
| May 7, 2015 | 21.86 |
| Jul 25, 1992 | 21.76 |
| Jun 24, 1963 | 21.39 |
| Jun 5, 2008 | 21.3 |
| Aug 23, 1954 | 21.16 |
| May 5, 1959 | 21.12 |
| Jun 19, 2020 | 20.94 |
| Mar 27, 1960 | 20.85 |
| Jul 2, 1956 | 20.82 |
| Jul 14, 1952 | 20.71 |
| May 23, 2004 | 20.34 |
| Jun 13, 1984 | 20.3 |
| Oct 11, 1986 | 20.18 |
| Jul 25, 1993 | 20.1 |
| Oct 11, 1973 | 20.1 |
| Jul 20, 1962 | 20.05 |
| Oct 10, 1973 | 19.86 |
Data provided by the National Weather Service.