Sequatchie River near Whitwell
Critical Stages
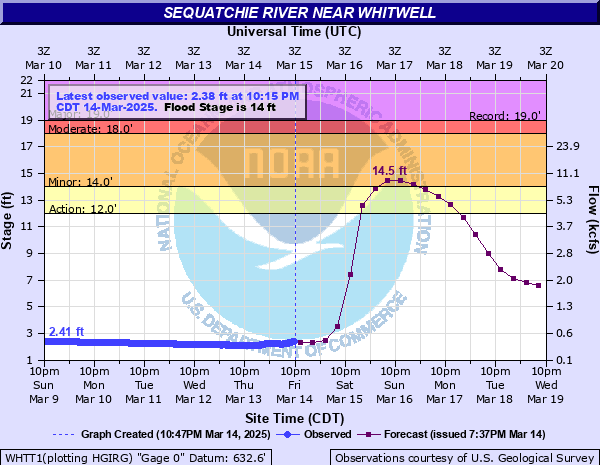
12' - Action
14' - Flood
18' - Moderate
19' - Major
Latest Observation
Updated: 8:15 AM CST 12/6/25
Status: No Flooding
Stage: 2.3 ft
Flow: 0.328 kcfs
Forecast
| Time | Stage (ft) | Flow (kcfs) |
|---|---|---|
| 12 PM 12/6 | 2.3 | 0.328 |
| 6 PM 12/6 | 2.3 | 0.328 |
| 12 AM 12/7 | 2.3 | 0.328 |
| 6 AM 12/7 | 2.3 | 0.328 |
| 12 PM 12/7 | 2.3 | 0.328 |
| 6 PM 12/7 | 2.3 | 0.328 |
| 12 AM 12/8 | 2.3 | 0.328 |
| 6 AM 12/8 | 2.3 | 0.328 |
| 12 PM 12/8 | 2.3 | 0.328 |
| 6 PM 12/8 | 2.2 | 0.301 |
| 12 AM 12/9 | 2.2 | 0.301 |
| 6 AM 12/9 | 2.2 | 0.301 |
| 12 PM 12/9 | 2.2 | 0.301 |
| 6 PM 12/9 | 2.2 | 0.301 |
| 12 AM 12/10 | 2.2 | 0.301 |
| 6 AM 12/10 | 2.2 | 0.301 |
| 12 PM 12/10 | 2.2 | 0.301 |
| 6 PM 12/10 | 2.2 | 0.301 |
| 12 AM 12/11 | 2.2 | 0.301 |
| 6 AM 12/11 | 2.1 | 0.284 |
| Time | Stage (ft) | Flow (kcfs) |
|---|---|---|
| 8:15 AM 12/6 | 2.3 | 0.328 |
| 8:00 AM 12/6 | 2.3 | 0.328 |
| 7:45 AM 12/6 | 2.3 | 0.328 |
| 7:30 AM 12/6 | 2.3 | 0.328 |
| 7:15 AM 12/6 | 2.3 | 0.328 |
| 7:00 AM 12/6 | 2.3 | 0.328 |
| 6:45 AM 12/6 | 2.3 | 0.328 |
| 6:30 AM 12/6 | 2.29 | 0.325 |
| 6:15 AM 12/6 | 2.29 | 0.325 |
| 6:00 AM 12/6 | 2.29 | 0.325 |
| 5:45 AM 12/6 | 2.29 | 0.325 |
| 5:30 AM 12/6 | 2.29 | 0.325 |
| 5:15 AM 12/6 | 2.29 | 0.325 |
| 5:00 AM 12/6 | 2.28 | 0.321 |
| 4:45 AM 12/6 | 2.28 | 0.321 |
| 4:30 AM 12/6 | 2.28 | 0.321 |
| 4:15 AM 12/6 | 2.28 | 0.321 |
| 4:00 AM 12/6 | 2.27 | 0.318 |
| 3:45 AM 12/6 | 2.28 | 0.321 |
| 3:30 AM 12/6 | 2.27 | 0.318 |
| 3:15 AM 12/6 | 2.27 | 0.318 |
| 3:00 AM 12/6 | 2.27 | 0.318 |
| 2:45 AM 12/6 | 2.27 | 0.318 |
| 2:30 AM 12/6 | 2.27 | 0.318 |
| 2:15 AM 12/6 | 2.27 | 0.318 |
| 2:00 AM 12/6 | 2.27 | 0.318 |
| 1:45 AM 12/6 | 2.27 | 0.318 |
| 1:30 AM 12/6 | 2.27 | 0.318 |
| 1:15 AM 12/6 | 2.26 | 0.315 |
| 1:00 AM 12/6 | 2.27 | 0.318 |
19' -
Water reaches the bottom of the bridge at Teague Road.
18' -
Moderate flooding begins. River Mill Road, Teague Road, Ketner's Mill Road, and Old Ketner's Road flood and become impassable.
16' -
Flooding of agricultural land becomes more extensive. Water reaches the bottom of the river gage house. Portions of Mt. Calvary Road along the river are inundated.
14' -
Flooding of agricultural land occurs. Portions of Mt. Calvary Road along the river may begin to flood.
| Date | Stage (ft) |
|---|---|
| Mar 1, 1867 | 19 |
| Dec 23, 1990 | 18.02 |
| Feb 1, 1975 | 18 |
| May 6, 2003 | 17.76 |
| Mar 16, 1973 | 17.65 |
| Mar 12, 1963 | 17.11 |
| Feb 16, 2003 | 16.79 |
| Nov 19, 1957 | 16.71 |
| Feb 11, 1994 | 16.68 |
| Dec 30, 1969 | 16.66 |
| Jan 5, 1949 | 16.55 |
| Feb 24, 2019 | 16.42 |
| Mar 24, 1993 | 16.3 |
| Dec 28, 1942 | 16.29 |
| Feb 6, 2020 | 16.26 |
| Jan 8, 1946 | 16.23 |
| Feb 14, 1948 | 16.22 |
| Dec 26, 1973 | 16.14 |
| Apr 6, 1983 | 16.1 |
| Dec 26, 2015 | 16.05 |
Data provided by the National Weather Service.