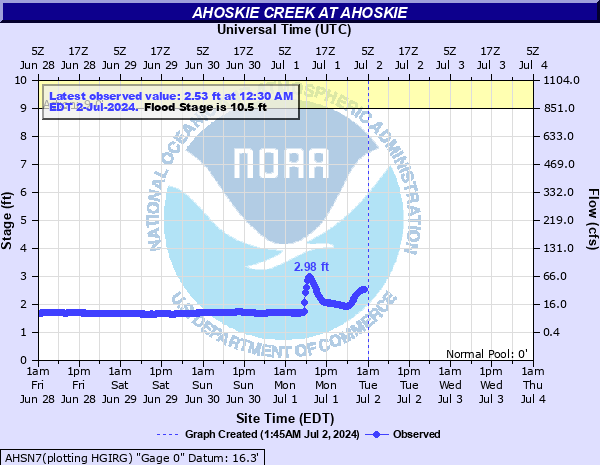
Ahoskie Creek at Ahoskie
Critical Stages
9' - Action
10.5' - Flood
12.5' - Moderate
15' - Major
Latest Observation
Updated: 8:30 AM EST 12/6/25
Status: No Flooding
Stage: 1.98 ft
Flow: 0.015 kcfs
Forecast
Forecast not available for this location.
| Time | Stage (ft) | Flow (kcfs) |
|---|---|---|
| 8:30 AM 12/6 | 1.98 | 0.015 |
| 8:15 AM 12/6 | 1.98 | 0.015 |
| 8:00 AM 12/6 | 1.98 | 0.015 |
| 7:45 AM 12/6 | 1.98 | 0.015 |
| 7:30 AM 12/6 | 1.98 | 0.015 |
| 7:15 AM 12/6 | 1.98 | 0.015 |
| 7:00 AM 12/6 | 1.98 | 0.015 |
| 6:45 AM 12/6 | 1.98 | 0.015 |
| 6:30 AM 12/6 | 1.98 | 0.015 |
| 6:15 AM 12/6 | 1.98 | 0.015 |
| 6:00 AM 12/6 | 1.98 | 0.015 |
| 5:45 AM 12/6 | 1.98 | 0.015 |
| 5:30 AM 12/6 | 1.98 | 0.015 |
| 5:15 AM 12/6 | 1.98 | 0.015 |
| 5:00 AM 12/6 | 1.98 | 0.015 |
| 4:45 AM 12/6 | 1.97 | 0.015 |
| 4:30 AM 12/6 | 1.98 | 0.015 |
| 4:15 AM 12/6 | 1.98 | 0.015 |
| 4:00 AM 12/6 | 1.98 | 0.015 |
| 3:45 AM 12/6 | 1.98 | 0.015 |
| 3:30 AM 12/6 | 1.98 | 0.015 |
| 3:15 AM 12/6 | 1.98 | 0.015 |
| 3:00 AM 12/6 | 1.98 | 0.015 |
| 2:45 AM 12/6 | 1.98 | 0.015 |
| 2:30 AM 12/6 | 1.98 | 0.015 |
| 2:15 AM 12/6 | 1.98 | 0.015 |
| 2:00 AM 12/6 | 1.98 | 0.015 |
| 1:45 AM 12/6 | 1.98 | 0.015 |
| 1:30 AM 12/6 | 1.98 | 0.015 |
| 1:15 AM 12/6 | 1.98 | 0.015 |
20.14' -
River stage sensor operating limit
16' -
Homes along Stoke and Camlin Street adjacent to Ahoskie Creek Park begin to flood. Several businesses south of town along US Highway 13 begin to flood.
15' -
Many businesses along South Academy Street are inundated with a couple feet of water. South Academy Street begins to flood. Portions of US Highway 13 south of town are flooded.
14' -
Numerous businesses along State Route 42, South Academy Street, are flooded. Most of Ahoskie Creek Park is flooded.
12.5' -
Homes and businesses northeast of the Ahoskie Creek along State Route 42 and along Lee Jernigan Road begin to flood.
11.5' -
Parking lots along Route 42 southwest of Ahoskie Creek begin to flood.
10.5' -
Significant portions of the Ahoskie Creek Park are flooded including areas around the picnic pavilion and amphitheater. Properties along Lee Jernigan Road begin to flood.
| Date | Stage (ft) |
|---|---|
| Sep 17, 1999 | 17.32 |
| Oct 10, 2016 | 15.42 |
| Oct 1, 2010 | 14.86 |
| Sep 23, 2016 | 13.41 |
| Jun 17, 2001 | 13.13 |
| Jun 1, 1984 | 12.49 |
| Aug 19, 1992 | 12.4 |
| Jun 16, 2006 | 11.44 |
| Oct 20, 1999 | 11.39 |
| Aug 17, 2004 | 11.23 |
| Aug 30, 2011 | 11.05 |
| Oct 5, 1964 | 10.72 |
| Feb 6, 1998 | 10.55 |
| Jan 14, 1968 | 10.5 |
| Jul 29, 2017 | 10.43 |
| Mar 10, 1994 | 10.42 |
| Jul 30, 2018 | 10.24 |
| Feb 26, 1979 | 10.23 |
| Jul 24, 2018 | 10.19 |
| Sep 14, 1960 | 10.11 |
Data provided by the National Weather Service.