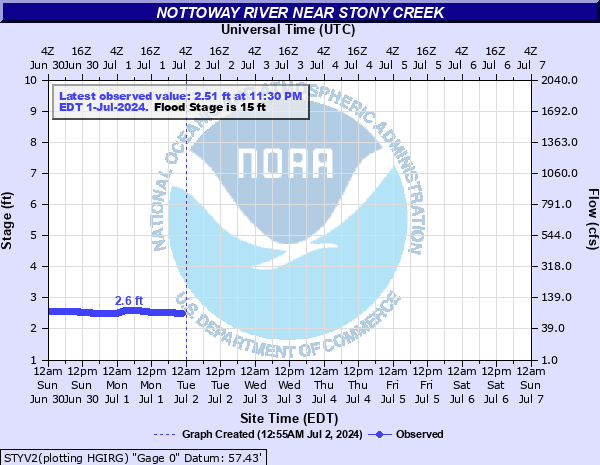
Nottoway River near Stony Creek
Critical Stages
13' - Action
15' - Flood
17' - Moderate
20' - Major
Latest Observation
Updated: 8:30 AM EST 12/6/25
Status: No Flooding
Stage: 3.54 ft
Flow: 0.237 kcfs
Forecast
Forecast not available for this location.
| Time | Stage (ft) | Flow (kcfs) |
|---|---|---|
| 8:30 AM 12/6 | 3.54 | 0.237 |
| 8:15 AM 12/6 | 3.54 | 0.237 |
| 8:00 AM 12/6 | 3.54 | 0.237 |
| 7:45 AM 12/6 | 3.54 | 0.237 |
| 7:30 AM 12/6 | 3.55 | 0.239 |
| 7:15 AM 12/6 | 3.55 | 0.239 |
| 7:00 AM 12/6 | 3.55 | 0.239 |
| 6:45 AM 12/6 | 3.55 | 0.239 |
| 6:30 AM 12/6 | 3.55 | 0.239 |
| 6:15 AM 12/6 | 3.55 | 0.239 |
| 6:00 AM 12/6 | 3.55 | 0.239 |
| 5:45 AM 12/6 | 3.56 | 0.241 |
| 5:30 AM 12/6 | 3.56 | 0.241 |
| 5:15 AM 12/6 | 3.56 | 0.241 |
| 5:00 AM 12/6 | 3.56 | 0.241 |
| 4:45 AM 12/6 | 3.56 | 0.241 |
| 4:30 AM 12/6 | 3.57 | 0.243 |
| 4:15 AM 12/6 | 3.57 | 0.243 |
| 4:00 AM 12/6 | 3.57 | 0.243 |
| 3:45 AM 12/6 | 3.57 | 0.243 |
| 3:30 AM 12/6 | 3.57 | 0.243 |
| 3:15 AM 12/6 | 3.58 | 0.245 |
| 3:00 AM 12/6 | 3.58 | 0.245 |
| 2:45 AM 12/6 | 3.59 | 0.247 |
| 2:30 AM 12/6 | 3.59 | 0.247 |
| 2:15 AM 12/6 | 3.59 | 0.247 |
| 2:00 AM 12/6 | 3.6 | 0.249 |
| 1:45 AM 12/6 | 3.6 | 0.249 |
| 1:30 AM 12/6 | 3.6 | 0.249 |
| 1:15 AM 12/6 | 3.61 | 0.251 |
30.9' -
River stage sensor operating limit
28' -
Bridge across US Highway 301 begins to flood.
23' -
Several homes just south of the gage, along US Highway 301 begin to flood.
17' -
Jarratt boat ramp, approximately 5 miles upstream, has water completely covering the concrete boat launch area.
16' -
Lowlands between the town of Stony Creek and VA Route 640, along both sides of VA Route 40, are flooded. Also, flood waters from the Nottoway River back up into Stony Creek and flood Main Street between Hailfax Road and Cedar Road.
15' -
Minor flooding of lowlands begins in vicinity of the gage and downstream along VA Route 40.
| Date | Stage (ft) |
|---|---|
| Aug 17, 1940 | 23.66 |
| Oct 7, 1972 | 21.69 |
| Sep 17, 1999 | 21.28 |
| May 28, 2003 | 20.35 |
| Sep 21, 2003 | 20.35 |
| Oct 26, 1971 | 20.32 |
| Jul 20, 1945 | 20.3 |
| Nov 6, 1985 | 20.22 |
| Jul 16, 1975 | 20.09 |
| Feb 27, 1979 | 20.03 |
| Apr 28, 1937 | 20 |
| Jul 28, 1938 | 19.93 |
| Apr 19, 1987 | 19.69 |
| Oct 14, 2018 | 19.4 |
| Apr 29, 1978 | 19.39 |
| Mar 22, 1998 | 19.28 |
| Feb 16, 1984 | 19.19 |
| Sep 2, 2004 | 18.9 |
| Mar 7, 1993 | 18.49 |
| Oct 3, 1979 | 17.96 |
Data provided by the National Weather Service.